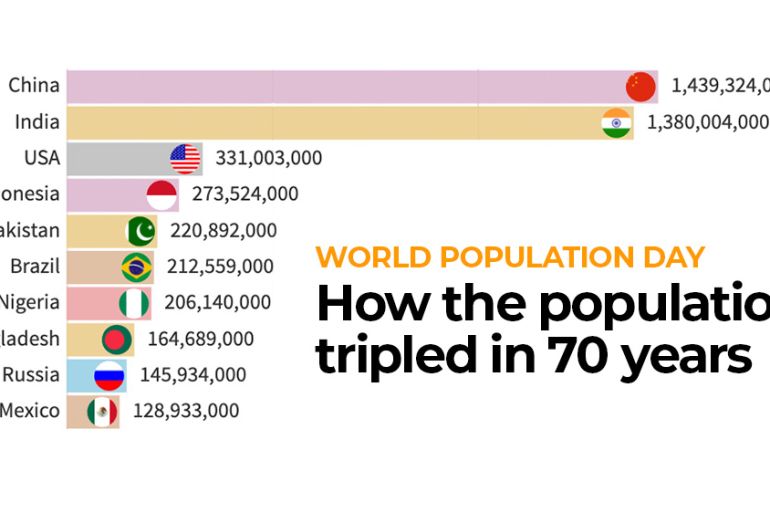
Infographic: How the world’s population tripled in 70 years
In 1955, there were 2.8 billion people on Earth. Today, that is the population of China and India alone.

People across the globe observe July 11 as the World Population Day – as designated by the United Nations to raise awareness about reproductive health and achieve sustainable development around the world.
The theme this year is focused on safeguarding the health and rights of women and girls around the world, especially during the ongoing COVID-19 pandemic.
Keep reading
list of 4 itemsMapping Israel-Lebanon cross-border attacks
Eid Mubarak: Hear greetings in different languages
When is Eid al-Fitr 2024 and how is it celebrated?
The animation below shows how the world grew from 2.5 billion people in 1950 to 7.7 billion now.
When the world’s population reached each billion milestone:
One billion – 1804
Two billion – 1927 (took 123 years)
Three billion – 1960 (took 33 years)
Four billion – 1974 (took 14 years)
Five billion – 1987 (took 13 years)
Six billion – 1999 (took 12 years)
Seven billion – 2011 (took 12 years)
Eight billion – 2024* (UN projection)
Which countries are growing the fastest?
Between 2019 and 2020, the world’s population grew by 1.1 percent. That may sound like a small number but it is more than 80 million people. While the world’s population is expected to increase over the next few decades, the speed at which it grows is slowing down.
The population of India is expected to overtake China by 2024, based on projections made by the UN’s Population Division. India would then become the world’s most populous country comprising one out of every six people on the Earth.
The animation below shows the top 10 fastest-growing countries per decade since the 1950s.
The fastest-growing continent over the past five years was Africa (2.51 percent) and the slowest growing was Europe (0.12 percent). In countries in the Middle East, an influx of foreign workers combined with a higher standard of living led to the sharpest population increases over the decades.
If you are curious, the countries with the maximum decreases in population size over the past five years were: Lithuania (-1.48 percent), Latvia (-1.15 percent), Venezuela (-1.13 percent), Bosnia and Herzegovina (-0.89 percent) and Bulgaria (-0.71 percent).
Explore your country
How has your country’s population grown over the past 70 years? Explore the interactive map below to find out.